Deliverability Center shows you, in one place, whether your email is reaching people and what to do when it is not. Every number can be broken down by sending domain, sender and receiving mailbox provider, and every problem comes with the action that fixes it.
It deliberately does not use open or click rates. Apple Mail Privacy Protection preloads every image and Gmail proxies them, so opens no longer tell you anything reliable. Instead, Deliverability Center uses two signals that cannot be faked:
Warmup placement. Every warmup email lands in a mailbox inside our warmup network, so we can see directly whether it reached the inbox or spam.
Campaign reply rate. We cannot look inside a prospect's mailbox, but mail that reaches the inbox gets replies and mail in spam does not. A falling reply rate is the earliest reliable sign of a placement problem.
One rule runs through the whole page: warmup numbers describe where mail landed; campaign numbers describe what the receiving server accepted and whether people replied. There is no "inbox rate" for campaigns, because nobody can measure one directly. To see where a specific campaign email lands, use the Inbox Placement Test, which measures it with seed accounts.
Deliverability Center covers email only. LinkedIn and WhatsApp are not included.
Deliverability Center has three tabs plus a link to the Inbox Placement Test. Every tab is laid out in the same order from top to bottom, so once you learn one tab, you know them all.
Tab | The question it answers | What's on it |
The Overview tab label shows a red count of open alerts. It goes down as you resolve them and disappears at zero.
Every tab has the same toolbar:
Date range. Choose Today (the default), 7 days, 30 days or 3 months. All ranges end today and include today. Each tab remembers its own range.
Filters. Sender ESP, Domain and Sender, on the Warmup and Campaigns tabs only. See Filters below.
3-month history. Hover to see how long data is kept. Warmup and campaign data are both kept for 3 months.
Export. Choose Download CSV for the raw rows behind the current tab, range and filters, or Branded PDF report for a client-ready summary with your workspace logo. Both are prepared in the background and emailed to you when ready.
Days are counted in your workspace time zone. If you are in a different zone, a send at 00:30 your time may appear on the previous day's bar.
The deliverability score is a single number from 0 to 100 that summarises your sending health. It appears as a ring on the Overview and as a bar in every table row and detail drawer. It is built from three parts:
Part | Weight | What it measures |
Each check is worth one sixth of the setup part. The detail drawer marks each as pass or fail, so you can see what is holding your score back.
SPF passing
DKIM passing
DMARC passing
DMARC enforced (p=quarantine or p=reject)
Domain older than 6 months
Warming for more than 21 days
SPF, DKIM, DMARC and domain age belong to the domain, and every sender on it inherits them. Days warming is measured per sender.
Band | Score | What it means |
Under the ring on the Overview you'll see the band, how many domains and senders the score covers, and a change badge against the previous period of the same length. For example, "+4 vs previous period" on a 30-day range compares the last 30 days with the 30 days before.
When filters are on, the score is the simple average of the matching senders' scores. A small sender counts the same as a large one, because a small sender at risk is still at risk.
If you only use warmup or only run campaigns, the score uses the parts it has data for and says so under the ring.
The Overview answers "is my mail getting through?" at a glance. It always covers your whole workspace and ignores filters. Its four summary cards put campaign and warmup health side by side.
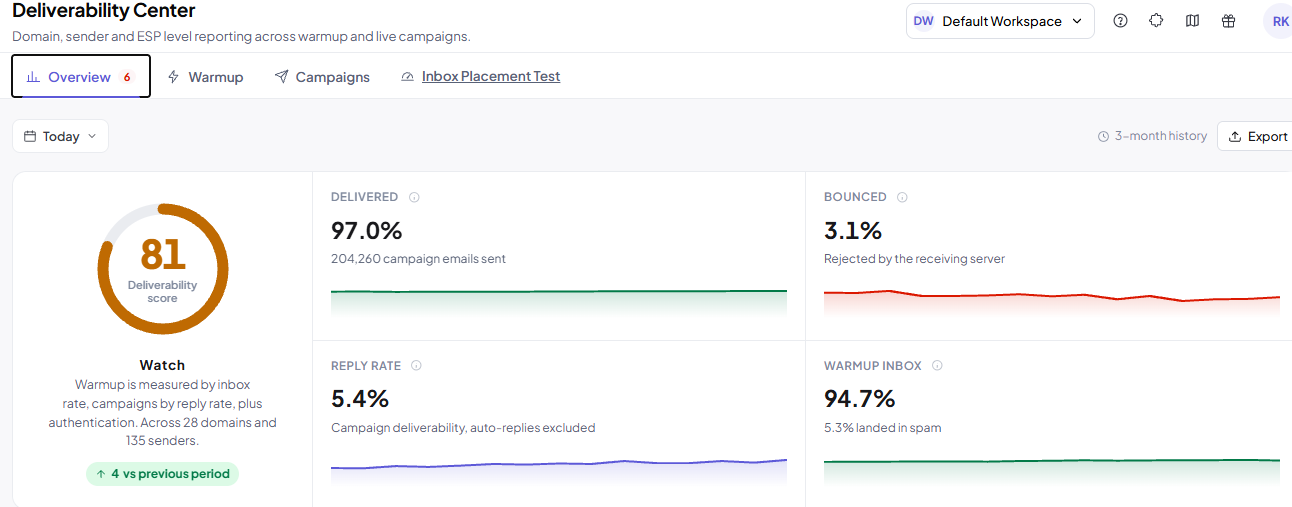
Card | What it means | Healthy |
Delivered and Bounced always add up to 100% of sent. A temporary rejection that later succeeds on retry counts as delivered; it only counts as a bounce once retries run out.
Delivered is not the same as inboxed. A server can accept an email and file it in spam, so Delivered can sit at 99% while your reply rate collapses. That is why reply rate is the number to watch for campaigns.
Needs attention. Your four most important open alerts across warmup and campaigns, ranked by how much sending volume is at risk. Click See all when there are more.
Warmup placement over time. Daily warmup inbox and spam lines. Hover for a day's values; click a legend item to hide that line.
Weakest domains. Your four lowest-scoring sending domains, with provider, sender count and reply rate. All domains opens the Campaigns tab.
Where your recipients are. Every receiving mailbox provider, ordered by share of your campaign volume, with its reply rate.
Recipients are grouped into six providers by their mail server (MX record), not by the domain in their address. A company domain hosted on Google Workspace is grouped with gmail.com, because both are filtered by the same Google system.
Gmail / Google Workspace
Microsoft 365
Outlook.com / Hotmail (kept separate from Microsoft 365, because consumer and business filtering differ)
Yahoo / AOL
Zoho Mail
Other / self-hosted
Share of volume uses campaign sends only. Warmup mail goes to our own warmup network, so its provider mix says nothing about where your real recipients are.
Everything on the Warmup tab is measured directly inside the warmup network. None of it includes campaign mail.
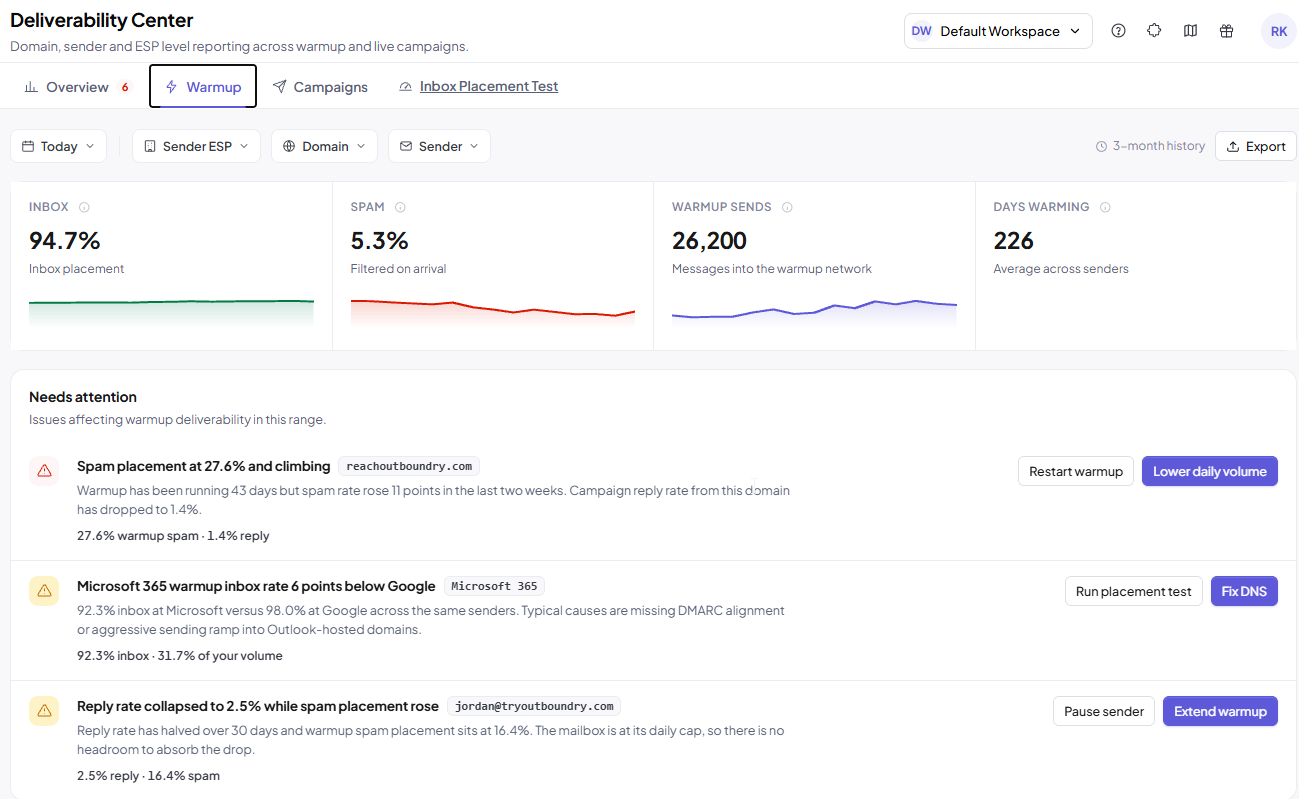
Metric | What it means | Healthy |
Gmail tabs. Gmail's Promotions and other tabs are not tracked separately yet, so they count as inbox.
Warmup sends. A flat or falling line while your senders are active can mean warmup was paused or disconnected.
Days warming. Under 21 days means the sender is still ramping up and its sending limits stay low. For a domain, it is the average across its senders, because a domain with one old sender and five new ones is still mostly ramping. It only resets if warmup is switched off and later back on; pausing or extending warmup does not reset it.
Reputation is a 30-day weighted average of four warmup inputs:
Inbox rate (50%): warmup emails in the inbox ÷ warmup emails sent
Spam rescue rate (20%): warmup emails moved from spam to inbox ÷ warmup emails that landed in spam (100 if nothing landed in spam)
Send success rate (20%): warmup emails accepted by the receiving server ÷ attempted, which is where blocks show up
Daily consistency (10%): share of the last 30 days on which the sender reached at least 90% of its planned warmup volume
Warmup placement over time. Stacked daily inbox and spam, always on a 0 to 100% scale so days are comparable.
Warmup sends over time. Daily warmup volume across the senders in view, which also shows the weekday rhythm.
If warmup is switched off for the senders in view, the tab shows the last data it has and a note to turn warmup back on in Email Accounts.
The Campaigns tab's four cards follow the path an email takes: it is sent, then delivered or bounced, then it gets replies. Warmup mail is never included.
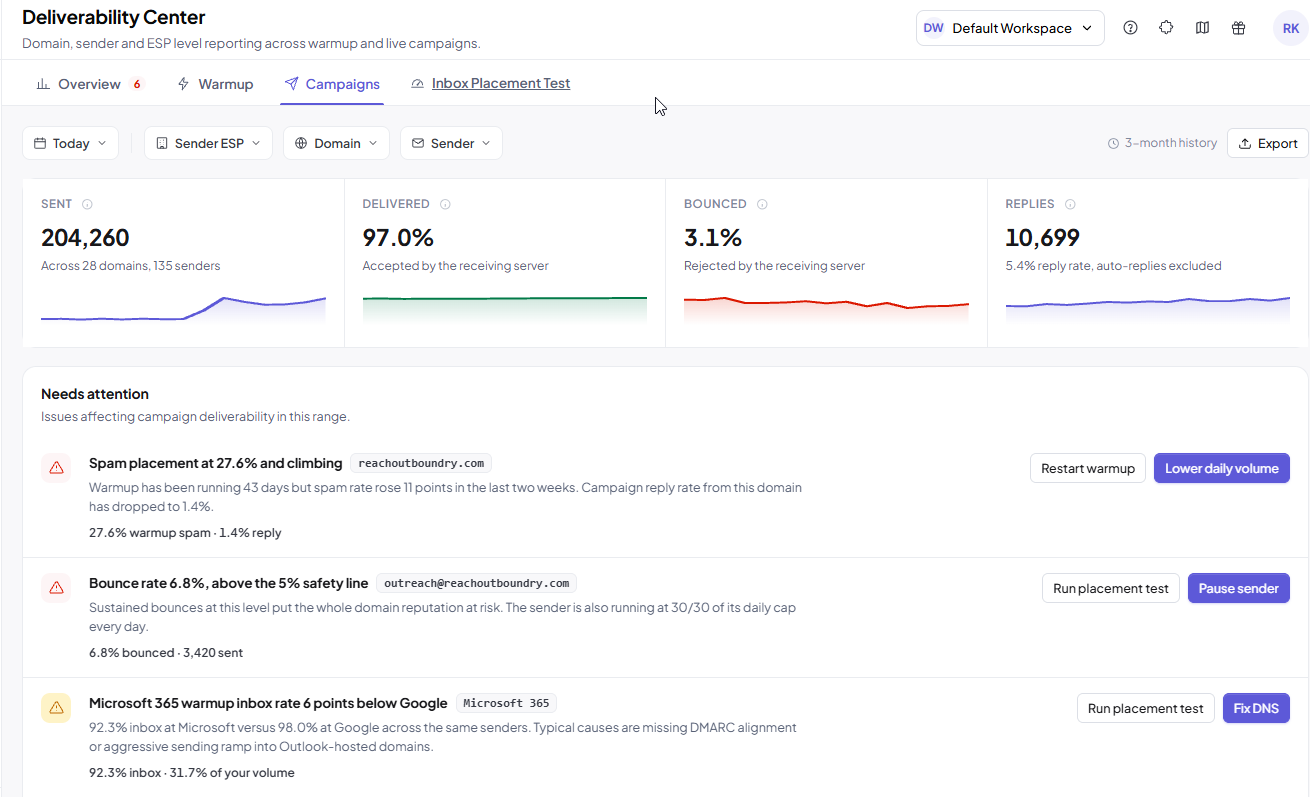
Card | What it means |
Reply rate is calculated on delivered emails, not sent, because a bounced email never had a chance to get a reply. In tables, the Replies column shows the rate rather than the count, so a large domain and a small one can be compared fairly.
Auto-replies and out-of-office messages are excluded, so a holiday wave in August or December won't look like a deliverability win. If a person writes back after an auto-reply, that reply is counted once.
Reply rate over time. The daily reply rate, and the most important chart on the page. A sustained drop usually means mail is landing in spam.
Bounce rate over time. The daily bounce rate. Above 3% puts your domain reputation at risk.
Weekends send less campaign mail, so daily rates swing more on Saturdays and Sundays. One weekend spike is not a trend.
If you have no campaign sends in the selected range, the cards show a dash and "No campaign sends in this range" rather than zeros.
The Warmup and Campaigns tabs each end with a breakdown table that takes you from a bad number to the domain, sender or provider causing it. Use the switch in the table header to choose the level.
Level | Each row is | Detail shown under the name |
Columns on the Warmup table: Score, Inbox · spam bar, Inbox, Spam, Sent, Reputation, Days warming.
Columns on the Campaigns table: Score, Sent, Delivered, Bounced, Replies.
Sorting. Tables sort by Score, lowest first, so your weakest entity is always at the top. Click any column header to re-sort.
Search. Search domains by name or provider, and senders by address, name or domain. Search is not available at the ESP level.
Health filter. Show All, At risk, Watch or Healthy rows, each with a live count.
Red values. Inbox below 80%, Spam above 10%, Delivered below 95%, Bounced above 3%, and Replies below 3% are shown in red.
Paging. 25 rows per page by default, with 10, 50 and 100 available.
Definitions. Hover the info icon on any column header to see what it means.
Domain age is the time since the domain was registered, for example "6 weeks" or "14 months". If we can't get the registration date, we show the age from when we first saw the domain as "At least X months".
A domain's Sender ESP is the provider hosting most of its senders. Azure counts as Microsoft 365, and SMTP and IMAP mailboxes count as Others (SMTP).
Click any table row, an alert's entity name, or a row in Weakest domains or Where your recipients are to open a side drawer for that entity. It shows:
Header: name, health band and score. A paused sender shows a "Campaigns paused" badge.
Campaign deliverability: Sent, Delivered, Bounced and Replies, plus a reply rate chart.
Warmup: Inbox, Spam, Sent, Reputation and Days warming, plus a placement chart.
Setup: the six setup checks, each marked pass or fail.
By receiving ESP (domains and senders only): reply rate at each receiving provider. Below 50 delivered emails to a provider, the figure is an estimate and is marked "Est.".
Actions: the fixes available for that entity (see below).
On the Warmup and Campaigns tabs, you can narrow the view with three filters. The Overview is never filtered.
Sender ESP: mailboxes hosted on Google Workspace, Microsoft 365, Mailboundry or Others (SMTP). Each mailbox is matched on its own provider, so a domain with mixed providers can appear under more than one.
Domain: specific sending domains.
Sender: specific mailboxes.
Filters cascade: choosing a Sender ESP limits the Domain list, and choosing a domain limits the Sender list. Each active filter appears as a chip you can remove, or use Clear all. Warmup and Campaigns share the same filters, so switching tabs keeps you on the same senders.
Sender ESP is not the same as the ESPs table. The Sender ESP filter is about who hosts your mailboxes. The ESPs table level is about who hosts your recipients' mailboxes. A Google Workspace sender mails recipients on every provider.
Metric | How it combines across senders |
A new sender with no sends shows dashes rather than 0%, and is left out of totals until it sends its first email, so it can't drag your averages down.
An alert is raised when a domain, sender or receiving provider crosses a threshold. Each alert shows its severity, the number that triggered it, a plain-language reason, the supporting metrics, and two buttons: the recommended fix and an alternative.
Severity | Used when | Examples |
Alerts are only raised once an entity has sent at least 50 emails of that kind (warmup or campaign) in the selected range. Rates on very small volumes swing too much to act on: with 12 sends, one reply is 8.3%, and none is 0%.
Where alerts appear. The Overview shows every open alert, top 4 first, ranked by sending volume at risk. The Warmup and Campaigns tabs show only the alerts relevant to that tab and the senders you've filtered to. If an entity has two problems, such as high bounces and low replies, you'll see two separate alerts, because the fixes differ.
Action | What it does | Available on |
Pause sending asks you to confirm first, because it stops sending outright. Warmup keeps running, which is what lets reputation recover. Queued campaign steps wait rather than being skipped, and continue where they stopped when you click Resume sending, within that day's cap. You can also resume from Email Accounts.
Lower daily volume multiplies the cap by 0.6, then raises it back to the original over 14 days, with changes applied overnight in your workspace time zone. If you edit the cap yourself during the ramp, the ramp stops and your value is kept.
Restart or extend warmup turns warmup on if it is off and switches it to recovery mode. The campaign cap is held at 50% for 30 days, then returns to its previous value. If a Lower daily volume ramp is also running, the lower cap applies. Editing the cap yourself ends the hold.
Run placement test prefills the sender you started from. From a domain, it prefills the domain's lowest-scoring sender, which you can change. From a receiving provider, it preselects that provider's seed accounts.
Fix DNS opens Email Accounts filtered to that domain. From a receiving provider, it shows every domain with a failing SPF, DKIM or DMARC check.
Pause sending, Lower daily volume and Restart or extend warm-up take effect straight away and mark the alert resolved. Run placement test and Fix DNS do not resolve the alert, because they measure or point to the problem rather than change your sending.
An alert also closes on its own once its metric has been back inside the threshold for 7 days, and the activity log records it. Resolving an alert applies across your whole workspace, whatever filters were on at the time.
Metric | Healthy | Watch | Needs attention |
A healthy score can still sit alongside one red number, because the score blends three inputs. When that happens, act on the red value and any alert, not on the band.
Where are my open rates?
They are left out on purpose. Apple and Gmail load images on the recipient's behalf, so opens no longer measure anything reliably. Reply rate does.
Why is Delivered 98% when my campaign got almost no replies?
Delivered means the receiving server accepted the email, not that it reached the inbox. The server may have filed it in spam. Check the warmup spam figure for the same domain, and run an Inbox Placement Test.
Why is there no inbox rate for campaigns?
We can't see inside a prospect's mailbox. Warmup inbox is measured directly in our network; for a campaign email, use the Inbox Placement Test.
My bounce rate jumped to 8% for two days. Is something broken?
Usually not. A sudden spike typically comes from an unverified lead list rather than your infrastructure. If one sender goes above 5%, a critical alert fires on it. Verify the list in Email Verification before resuming.
Why can I only go back 3 months?
Warmup and campaign data are kept for 3 months, which covers the period that matters for today's sending decisions.
What's the difference between Sender ESP and the ESPs table?
Sender ESP is who hosts your mailboxes. The ESPs table is who hosts your recipients' mailboxes.
What does the time next to a domain, like "6 weeks", mean?
It's the domain's age since registration. "At least" means we couldn't get the registration date and are counting from when we first saw the domain.
Does pausing a sender stop warm-up?
No. Only campaign sends stop. Warmup keeps running so reputation can recover, and queued campaign steps continue where they left off when you resume.
Why are gmail.com recipients grouped with Google Workspace?
Both are filtered by the same Google system, so they behave the same for deliverability.
Why didn't the alert go away after I ran a placement test?
A test measures the problem; it doesn't fix it. The alert clears when you take an action that changes your sending, or when the metric has been back inside the threshold for 7 days.
Why don't I see anything?
If no email account is connected yet, Deliverability Center shows two options instead: connect an email account, or run a placement test. If your filters match no senders, you'll see "No senders match these filters" with a link to clear them.